Box scores don't do it for me. While I'm looking for the game's story line, all I get is a table of stats with no context - trivia.
I want to know what made the game interesting - or uninteresting.
- Did one team get completely steamrolled?
- Were opportunities to score wasteful?
- Were there any big plays?
- How did the final score materialize on the field?
Box scores don't answer any of those questions well.
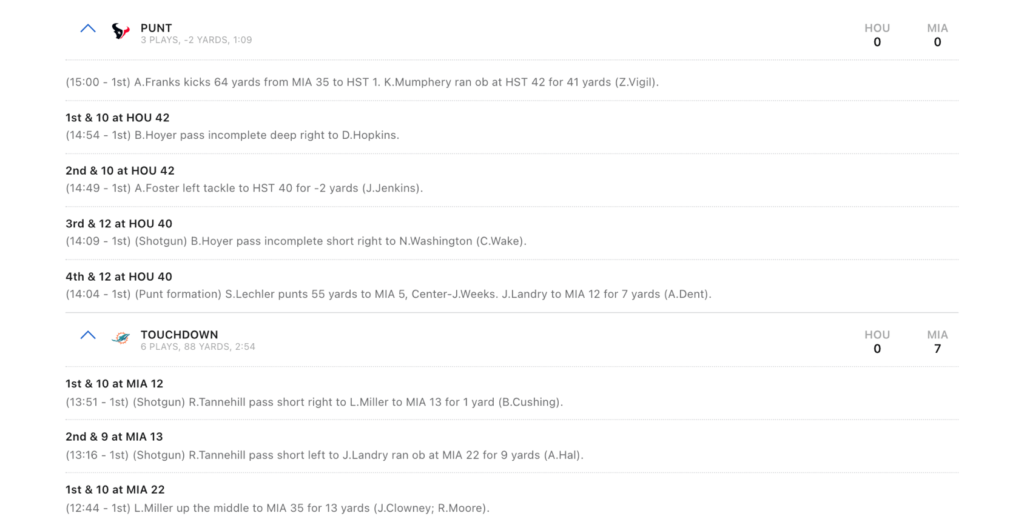
The game's play-by-play recaps are even worse. Reading a written description of each play in the game is like trying to listen to a song by reading its sheet music.

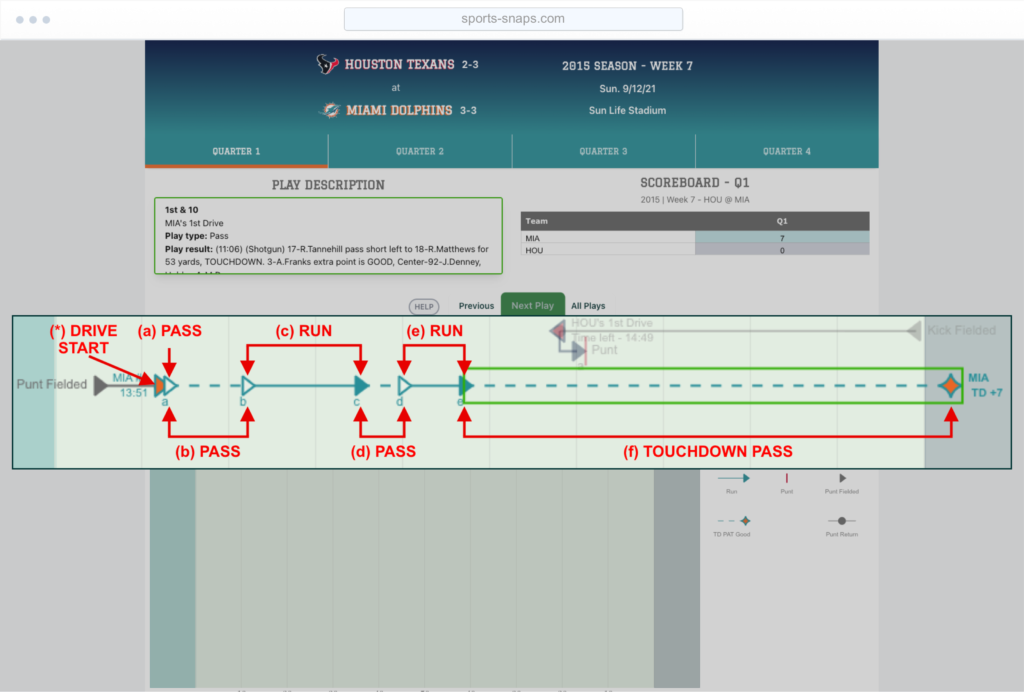
I created an improvement for play-by-play descriptions in sports-snaps.com. A chart/graphical version of play-by-play descriptions. While not perfect, it's at least a start.

As for box scores, that's what I'm tackling this off-season. Advanced stats in football have been commonplace in the analytics community for years. Success rate and expected points added (EPA) are only recently heard in some mainstream media. I'll be sharing my version of an improved, visual-first, game recap. Hopefully it will tell the game's story better than a traditional box score.
Check out my head start on sports-snaps.com.
